The bathtub curve is a useful tool for data center executives and operators to visualize the reliability of their assets over a period of time. It presents a graphical representation of the failure rate of an asset throughout its entire lifecycle, providing a quick view into performance and reliability and helping inform key decisions.
Knowing what the bathtub curve is, how to build one, and how to apply it to data center asset management can make a key difference in your uptime and bottom line.
What is the Bathtub Curve?
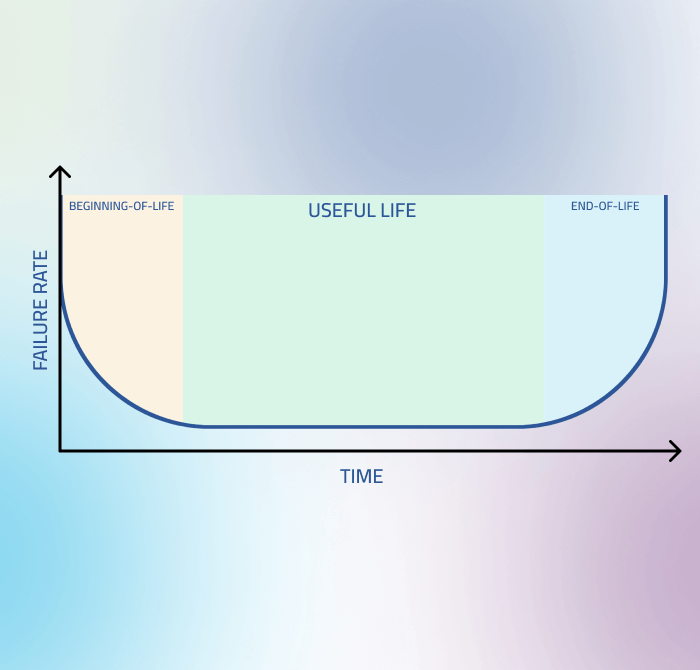
The bathtub curve shows the number of failures for mission critical assets across three distinct phases of their lifecycle:
- Beginning-of-Life: Also known as the Infant Mortality phase, this phase is characterized by a high early failure rate, typically due to manufacturing defects or installation errors.
- Useful Life: This normal life phase is characterized by a relatively constant failure rate. Failures during this phase are typically due to random events, such as power surges or hardware failures.
- End-of-Life: This phase is characterized by an increasing wear-out failure rate, as the asset ages and components begin showing wear and tear.
Determinants of the Bathtub Curve
The determinants of the bathtub curve vary depending on the type of asset, but some common factors include:
- Manufacturing quality: Assets that are manufactured to a high standard are likely to see fewer infant mortality failures.
- Operating environment: Assets that are operated in a harsh environment, such as a hot and dusty data center, are more likely to fail prematurely.
- Maintenance practices: Regular maintenance can help to extend the life of assets and reduce the failure rate during the useful life phase.
Practical Applications of the Bathtub Curve in Data Center Asset Management
Data center operators, executives, and analysts can use the bathtub curve to:
- Predict asset failures: By understanding the bathtub curve for different types of assets, data center operators can predict when assets are most likely to fail. This information can be used in determining formulas for predictive maintenance, saving you costs in parts and labor.
- Optimize asset maintenance: The bathtub curve can be used to determine the most cost-effective maintenance strategies for different types of assets. For example, assets that are in the wear-out phase may be better off being replaced than repaired.
- Make informed decisions about asset replacement: Observing an increasing failure rate through the bathtub curve can help determine the optimal time to replace assets. For example, assets that are in the end-of-life phase are more likely to fail unexpectedly, so it may be necessary to replace them before they reach the end of their expected life.
- Identify abnormal breakdowns and failure rates: Using historical information on your assets as well as industry reliability benchmarking, you can identify higher failure rates than normal, helping you address potential manufacturing defects or inefficiencies in your processes.
Best Practices for Using the Bathtub Curve to Optimize Asset Maintenance and Reliability
- Collect internal data: The first step is to collect data on your data center’s asset failures. This data can be used to create bathtub curves related to your different types of assets.
- Gather industry benchmarking data: Real-world global benchmarking on asset reliability gives your data center a baseline to compare your assets against. Knowing key metrics from the rest of the industry, including typical bathtub curve, mean time between failures (MTBF), mean time to repair (MTTR), failure mode, and more, gives you more data to make better informed decisions on practices and purchases.
- Analyze the data: Once you have collected data on asset failures, you can use it to analyze the bathtub curves for different types of assets. This analysis will help you to understand the determinants of equipment failure for your assets and to identify areas where you can improve asset maintenance and reliability.
- Develop maintenance strategies: Based on your analysis of the bathtub curves, you can develop maintenance strategies for different types of assets. These strategies should focus on preventing failures during the normal life phase and extending the life of assets during the wear-out phase. With the right data and data center operating system, you can develop predictive maintenance practices that help you stay ahead of failures and avoid unnecessary maintenance and repairs.
- Monitor and improve: It is important to monitor the effectiveness of your maintenance strategies and to make adjustments as needed. You can do this by collecting data on asset failures and analyzing the bathtub curves over time.
How to Determine the Bathtub Curve for Your Assets
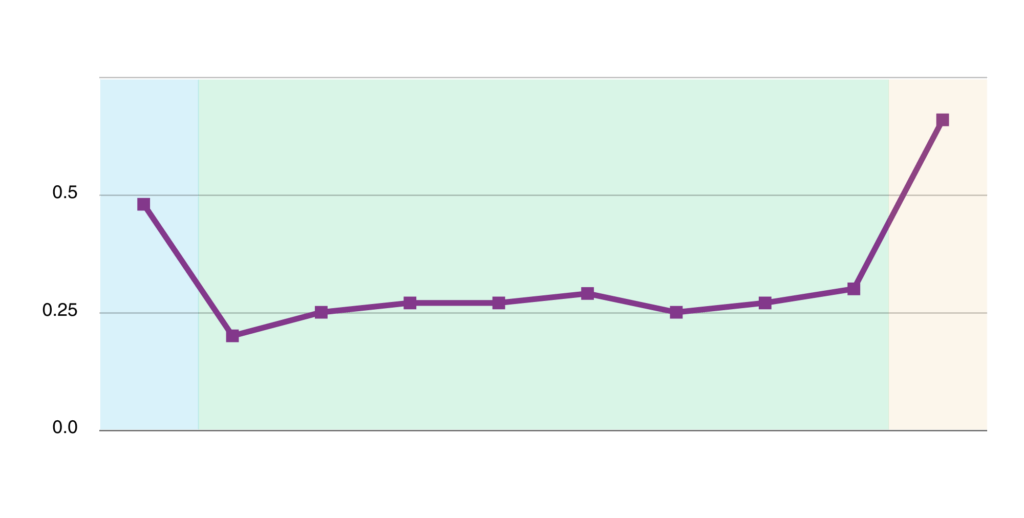
To determine the bathtub curve for your assets, you will need to collect data on asset failures against the age of your assets at the time of failure.
After you have collected data on asset failures, you can use it to create a bathtub curve for each type of asset. To do this, you will need to plot the number of asset failures over time. The x-axis of the graph will represent time, and the y-axis will represent the number of asset failures.
Once you have created a bathtub curve for each type of asset, you can use it to identify the three phases of the curve: infant mortality phase, normal life phase, and wear-out phase.
Using the Bathtub Curve to Improve Asset Maintenance and Reliability
Once you understand the bathtub curve for your assets, you can use it to improve asset maintenance and reliability. Here are a few tips:
- Focus on predictive and preventative maintenance during the useful life phase to reduce the risk of unexpected and random failures.
- A predictive maintenance program can also help develop a replacement strategy during an asset’s end-of-life phase. Predictive maintenance programs use data and analytics to predict when assets are most likely to fail. This information can be used to schedule tasks or to replace assets before they fail.
- The bathtub curve can also be used to make informed decisions about asset investments. For example, if you are considering purchasing a new type of asset, you can use the bathtub curve to understand the expected failure rate of the asset. This information can be used to determine the cost of ownership of the asset and to make a decision about whether or not to purchase it.
Conclusion
The bathtub curve is a powerful tool that can be used to improve asset maintenance and reliability in data centers. By understanding the bathtub curve and its determinants, data center operators, executives, and analysts can develop proactive maintenance strategies that will help to reduce the risk of asset failures and extend the life of their assets.