Updated on February 20th, 2025
Ensuring asset reliability is essential for the smooth operation of data centers. While many key performance indicators (KPIs) can be set to measure productivity initiatives, it’s tough to truly know how your teams are performing without knowing how reliable your assets are. To solve for this, data center operators need to measure and analyze key metrics that provide insights into the performance and lifespan of their assets. By doing so, they can make data-driven decisions on processes, proactive and preventative maintenance, replacements, and upgrades, ultimately improving overall reliability and performance. Here are five key metrics that can help assess the reliability of assets within data centers.
5 Key Asset Reliability Metrics
1. Rate of Failure
One crucial metric for evaluating asset reliability is the number of equipment failures per asset. By keeping track of the frequency at which assets experience malfunctions or breakdowns, data center operators can gain valuable insights into asset performance and reliability. This metric allows them to identify problematic assets and implement proactive maintenance strategies to improve overall reliability and performance. And the ability to compare data across manufacturers can help data center operators make better informed decisions when it comes to spare parts and capital planning.
2. Failure Trends by Lifecycle Stage
Just as not all assets are the same, neither are the stages of their life.
Mission critical assets failures are visualized in a Bathtub Curve that typically includes three distinct phases of their lifecycle:
- Beginning-of-Life: Also known as the Infant Mortality phase, this phase is characterized by a high early failure rate, typically due to manufacturing defects or installation errors.
- Useful Life: This normal life phase is characterized by a relatively constant failure rate. Failures during this phase are typically due to random events, such as power surges or hardware failures.
- End-of-Life: This phase is characterized by an increasing wear-out failure rate, as the asset ages and components begin showing wear and tear.
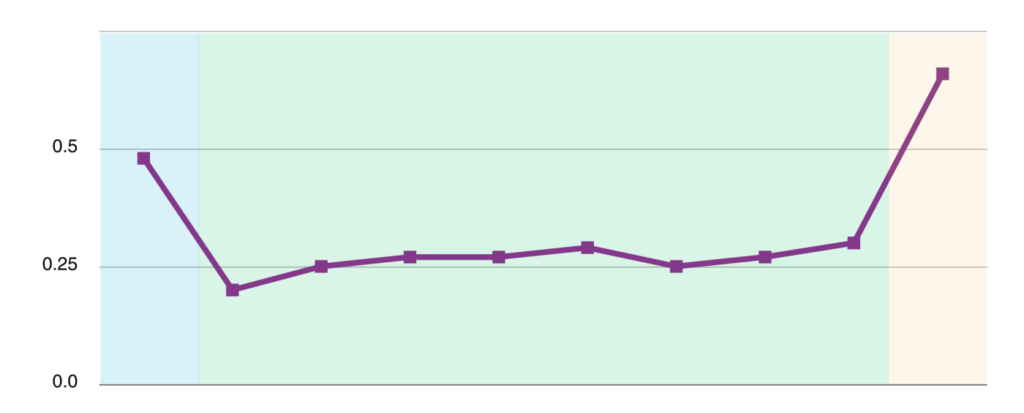
By monitoring the change in failure rate over time you can see a trend and know when an asset is coming up on the end of its useful life cycle. This proactive approach prevents disruptions and optimizes asset management, empowering your data center to make better informed decisions when planning capital budgets in the coming months or even years. Analyzing failure rate patterns also helps detect underlying issues and take prompt corrective action. By understanding the lifespan of assets, operators can make ensure the smooth operation of the data center.
3. Mean Time Between Failures (MTBF)
MTBF provides insights into the average time between failures, allowing operators to assess the overall reliability of their equipment. By calculating MTBF, operators can make informed decisions developing maintenance strategies, upgrades, and capital planning for replacements. Monitoring and analyzing MTBF helps operators in identifying potential issues and addressing them proactively, reducing downtime and improving overall performance.
4. Mean Time To Repair (MTTR)
Many factors can impact how long it takes to repair a failure. Is the asset difficult to repair? Are spare parts routinely unavailable? Could you be more efficient with your internal processes?
Knowing MTTR means knowing how long your data center could be down and where you can improve. And with the average cost of data center downtime costing between $5,600-$10,000 per minute, every moment counts.
5. Failure Mode and Root Cause Analysis
Knowing when to expect your assets to fail is great, but understanding how they’ll fail is important to getting ahead of any problems and being prepared to treat the root cause. Failure modes refer to specific ways in which assets fail, such as wear and tear or software glitches. Identifying these modes provides insights into areas needing improvement. Determining root causes involves investigating factors like design flaws or inadequate maintenance. Addressing root causes allows for corrective actions and data-driven decisions on your maintenance team’s processes and advance notice for capital planning. Understanding failure modes and root causes also optimizes spare parts inventory and reduces downtime, ultimately improving asset reliability, maintenance practices, and overall data center performance.
Wrapping Up
According to a recent survey by Gartner, Inc., more than half of respondents expressed a high degree of regret over their largest tech-related purchase in the last two years, with nearly 70% feeling their purchases fell below expectations. Having access to clean, reliable, real-time benchmarking data empowers data center operators to make better data-driven decisions on deployments, upgrades, or any capital expenses.
By measuring and analyzing these key metrics — rate of failure, trends by lifecycle stage, MTBF, MTTR, and failure mode and root cause — operators can gain valuable insights into the performance, lifespan, and potential issues of their assets. These metrics allow for data-driven decisions on maintenance procedures, spare parts, replacements, capital planning, and more, ultimately improving your data center’s overall reliability and performance and keeping your customers very happy.